
ChatterKB
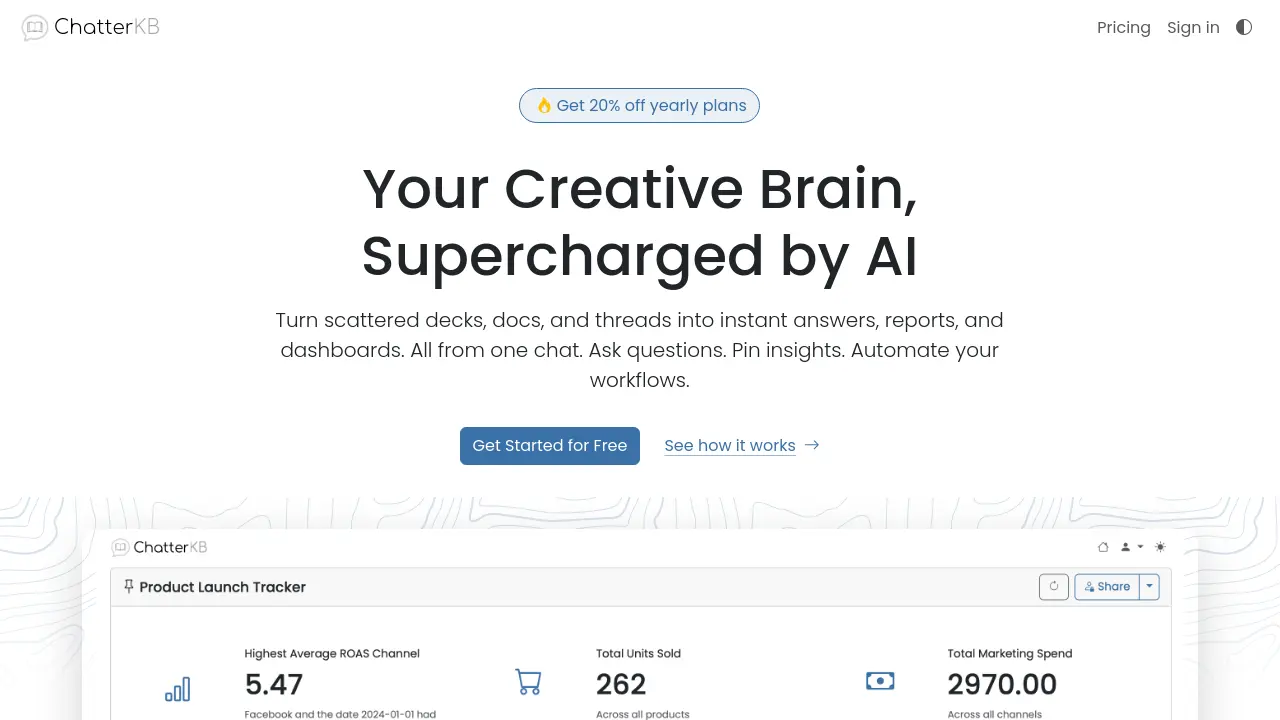
Your Creative Brain, Supercharged by AI
Description
ChatterKB is an AI tool designed to consolidate information from various sources like documents, spreadsheets, slide decks, Slack threads, Google Drive, Notion, and YouTube transcripts into a single, intelligent knowledge base. It addresses common challenges such as information overload, difficulty locating specific data across platforms, and siloed team insights.
Users interact with their consolidated knowledge through a conversational chat interface, asking questions in plain English to retrieve information, generate summaries, or analyze data quickly. The platform allows pinning key insights, tables, or charts derived from chats onto shareable dashboards, facilitating collaboration and reporting. ChatterKB aims to streamline the process of turning raw data and documents into actionable insights and is developing capabilities for automating knowledge-based workflows using natural language commands.
Key Features
- Diverse Data Upload: Supports drag-and-drop for docs/slides and connections to Google Drive, Notion, Slack, and YouTube transcripts.
- AI-Powered Chat Interface: Ask questions in plain English to search, summarize, and analyze content from your knowledge base.
- Pin to Dashboards: Convert chat answers into visual elements (tables, scorecards, writeups) and pin them to shareable dashboards.
- Natural Language Automation (Coming Soon): Define and execute workflows using plain language commands.
- Workflow Integration (Coming Soon): Trigger workflows from events and connect to external apps via API or Zapier.
- Reproducible Workflows (Coming Soon): Save automated sequences for recurring tasks like reports and analysis.
Use Cases
- Analyzing marketing campaign performance and creative effectiveness.
- Building shareable client results dashboards.
- Tracking ecommerce inventory, sales trends, and generating product insights.
- Analyzing financial statements for comparisons, trends, and variance.
- Creating visual financial reports for stakeholders.
- Surfacing insights from user interviews and product feedback.
- Automating recurring reporting tasks across departments.
You Might Also Like

Quanta
Free TrialThe fastest accounting service for software companies

Pl@ntNet
FreeIdentify plants with photos and contribute to biodiversity research.

StakeWeb
FreemiumEarn money from your undeveloped domains
Yugo
FreemiumSeamlessly integrate AI with your web services

Translate.Photo
Freemium1-Click Translation of Designs into 75+ Languages