
Dataslide
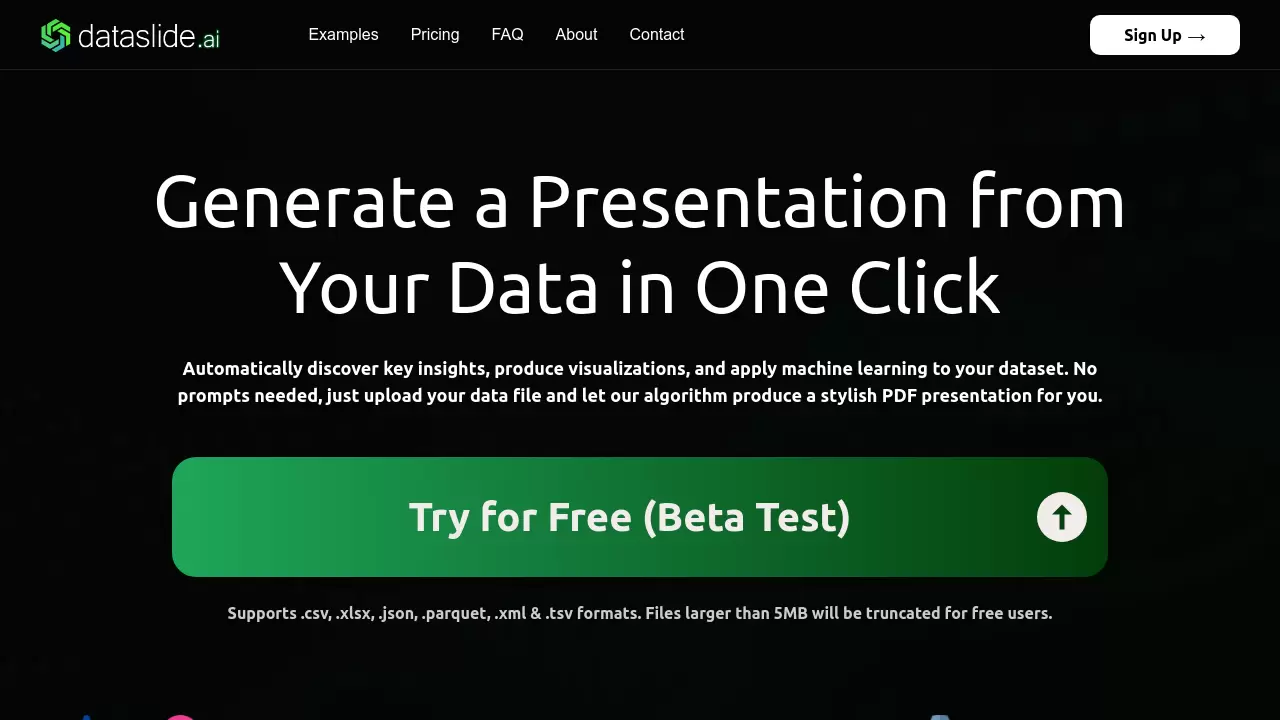
Generate a Presentation from Your Data in One Click
Freemium
Description
Dataslide is an AI-powered tool designed to automate the creation of data analysis presentations. Users can upload data files in formats like .csv, .xlsx, .json, and .parquet. The platform's algorithm then processes the dataset to automatically identify key insights, generate appropriate visualizations, and apply relevant machine learning techniques, such as data clustering, correlation analysis, and forecasting.
The core function is to transform raw data into a structured, stylish presentation (PDF or PowerPoint for premium users) swiftly, removing the need for manual analysis or complex prompts. It caters to users requiring rapid data interpretation, offering tiered plans based on file size limits and feature access, including options for unwatermarked outputs and branded styling in higher tiers.
The core function is to transform raw data into a structured, stylish presentation (PDF or PowerPoint for premium users) swiftly, removing the need for manual analysis or complex prompts. It caters to users requiring rapid data interpretation, offering tiered plans based on file size limits and feature access, including options for unwatermarked outputs and branded styling in higher tiers.
Key Features
- Automated Presentation Generation: Creates PDF/PowerPoint presentations from data.
- Insight Discovery: Automatically uncovers key findings.
- Data Visualization: Generates charts and graphs automatically.
- Machine Learning Application: Applies ML for clustering, forecasting, etc.
- No-Prompt Operation: Works without user-defined prompts.
- Multiple File Format Support: Supports .csv, .xlsx, .json, .parquet, .xml, .tsv.
- Data Cleaning: Includes automated data cleaning.
- Correlation Analysis: Performs correlation analysis.
- Outlier Detection: Identifies data outliers.
- Timeseries Analysis: Analyzes time-dependent data.
Use Cases
- Analyzing manufacturing production line performance.
- Exploring historical datasets (e.g., Titanic records).
- Generating insights from health data.
- Analyzing sensor data (e.g., temperature).
- Investigating patterns in machine failures.
- Studying weather and climate trends.
You Might Also Like

Gizmeon
Contact for PricingCutting-Edge Media and Ad Tech Company

Clevenio
PaidSales Intelligence Platform to Maximize Outreach Coverage

Redmenta
FreemiumThe only AI assistant for every step of the teaching process

ProgressMade.AI
FreemiumTransform Your Health Journey

Kollegio
FreeYour One-Stop Solution for College Apps